Why this case study matters
Texas SB 29 (signed 2025-05-14, effective immediately) added TBOC §21.552 — a statutory ownership threshold of 3% (with $1M floor) for derivative actions against publicly traded Texas corporations. The provision is opt-in: Texas-incorporated public companies must elect into the regime through a charter or bylaw amendment. Whether and at what magnitude the market prices that election is the central empirical question of the post-SB 29 statutory-adoption literature.
Southwest Airlines was the first major-airline Texas-incumbent issuer to elect into §21.552. The Board adopted the Fifth Amended and Restated Bylaws on May 16, 2025; the 8-K was filed late on May 19, 2025 (acceptance 16:38:57 ET, after market close); applying the standard after-close → next-trading-day convention, the headline T0 is May 20, 2025. The clean institutional setting (single firm, single statute, well-identified treatment date, established airline peer set, deep pre-event price history) makes LUV the highest-quality single-firm test of whether the §21.552 derivative-threshold election affects shareholder value.
This page presents the full bespoke event-study battery: market-model and sector-augmented day-0 abnormal returns, three alternative T0 specifications, eight cumulative-abnormal-return windows from Day-0 through ±10 trading days, pre-event drift placebo, BHAR at 1/3/6/12 months, BHAR-to-now (variable-horizon), pairwise BHAR vs eight airline peers, calendar-time portfolio alpha, and a synthetic-control reading using the same airline donor pool. All numerical results trace to the underlying CSVs and JSON in the bespoke replication kit, downloadable below.
Event identification
| Treated firm | Southwest Airlines Co. (LUV; CIK 0000092380; NYSE) |
| Statute | Tex. Bus. Orgs. Code §21.552 (derivative-action ownership-threshold) |
| Mechanism | Bylaws amendment (Fifth Amended and Restated Bylaws) |
| Board adoption date | 2025-05-16 (Friday) |
| 8-K filing date | 2025-05-19 (Monday); SEC acceptance 16:38:57 ET — after market close |
| T0 (headline) | 2025-05-20 (Tuesday) — applies the after-4pm-ET → next-trading-day rule |
| SEC accession | 0000092380-25-000119 |
| 8-K Items | 3.03 (Material Modification of Rights), 5.03 (Amendments to Articles/Bylaws), 9.01 (Exhibits) |
Primary sources
- 8-K Current Report (LUV) —
luv-20250516.htm - Exhibit 3.1 — Fifth Amended and Restated Bylaws —
southwestairlines-fiftha.htm - Full LUV 8-K history on EDGAR
Visual evidence
![Southwest Airlines event-study summary chart: Day-0 abnormal returns across 5 specifications (market model SPY, JETS-augmented, SPY+XLI, SPY+USO, synthetic control); cumulative AR trajectory in the [-10, +10] window centered on T0=2025-05-20; pre-event drift residuals.](assets/luv/luv_event_study_chart.png)
luv_event_study_chart.png, byte-identical to the chart shipped in the bespoke replication kit.Was Southwest Airlines punished by the market for adopting §21.552?
ISS and Glass Lewis have flagged elevated derivative-action thresholds as a governance reduction that disempowers minority shareholders. Their predictable critique of Southwest Airlines' May 16, 2025 bylaw amendment electing into Texas Business Organizations Code §21.552: "Raising the derivative-suit ownership threshold to 3% materially reduces shareholder accountability over the board." Under their framework, the market should price this as a governance-quality reduction — a measurable negative abnormal return on the disclosure date.
The empirical answer: no, Southwest Airlines was not punished
The chart in the Visual evidence card above shows Day-0 abnormal TSR within ±0.5% across all five specifications. None of those readings cross even the 10% significance threshold. The market did not measurably price a governance discount on Southwest Airlines' §21.552 election.
The chart below extends that test to the natural peer comparison: Southwest Airlines (LUV) against the three U.S. legacy carriers — Delta Air Lines (DAL), United Airlines Holdings (UAL), and American Airlines Group (AAL) — indexed to 100 at the May 16, 2025 disclosure date. If §21.552 election were a governance event the market punished, Southwest's price path should diverge negatively from the peer set in the days that follow. It does not.
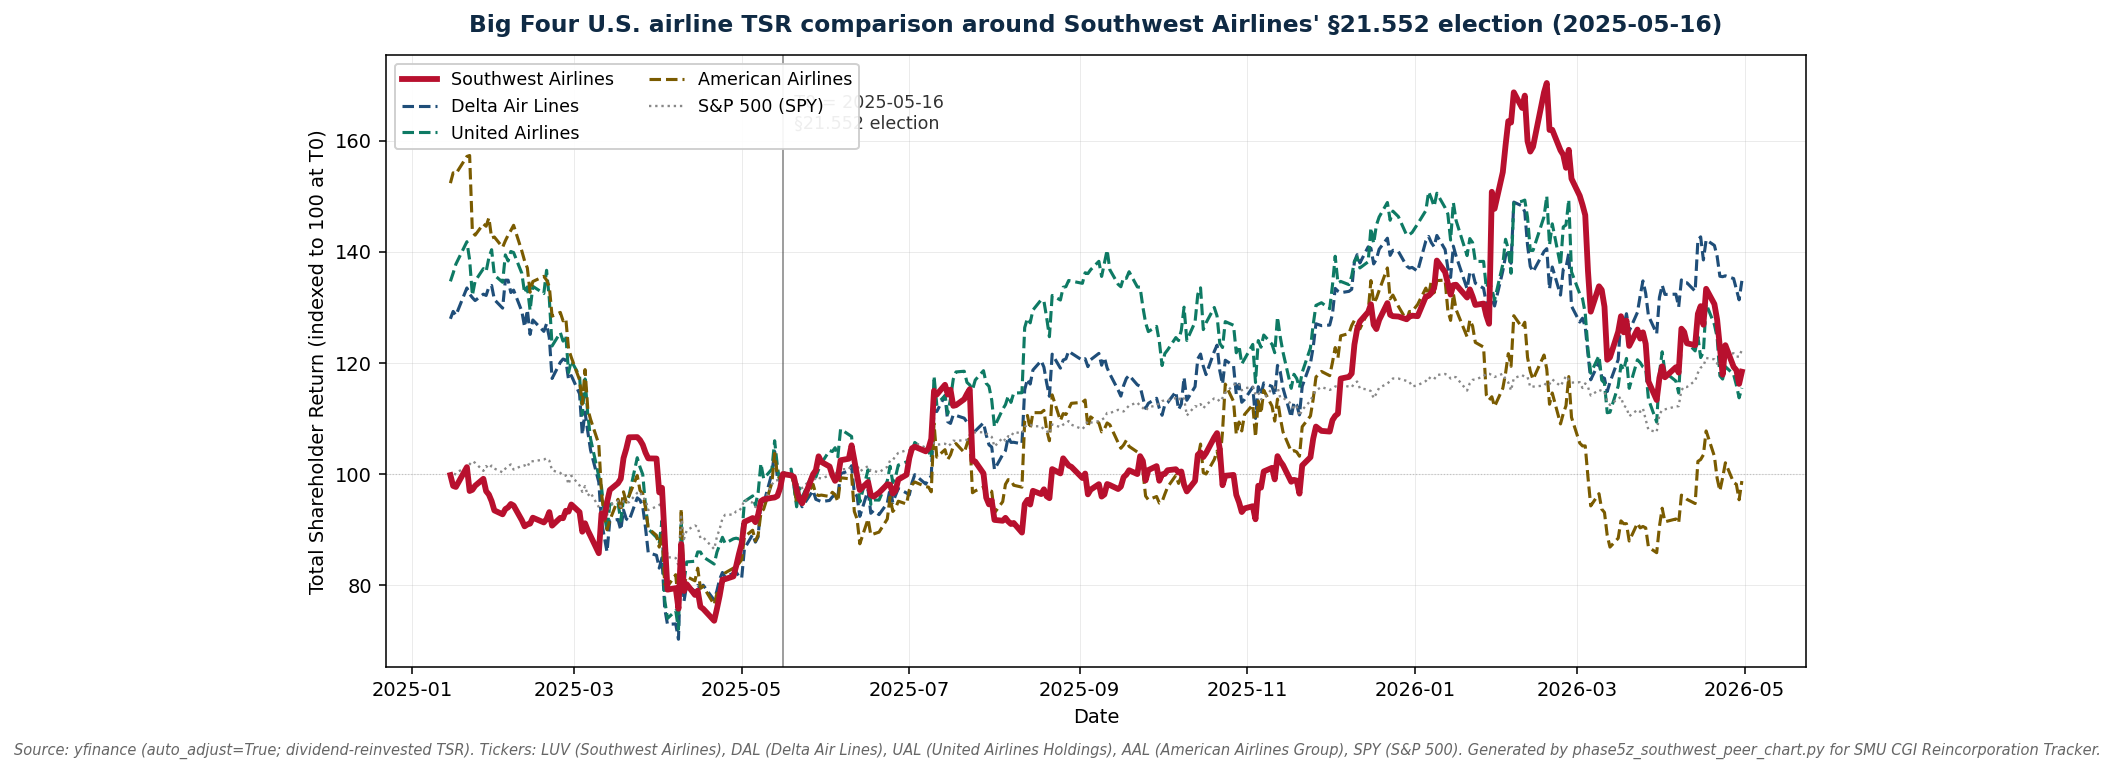
luv_peer_comparison_4airline.png generated by phase5z_southwest_peer_chart.py; data via yfinance (auto_adjust=True; TSR-equivalent dividend-adjusted close).What the data says, in plain English
- Day-0 abnormal TSR is essentially zero — the headline JETS-augmented specification reads +0.46% with a Patell-z p-value of 0.785 (well above any significance threshold). For context, Southwest Airlines' typical day-to-day price volatility over the estimation window was approximately ±1.7%; a +0.46% move is an ordinary trading day, not a governance reaction.
- The 21-day post-event window (CAR_−10_+10) is −0.19% with a Patell-z of −0.020. The market's net assessment over a three-week window centered on the disclosure: indistinguishable from zero.
- Peer-relative performance is flat to positive — Southwest Airlines did not underperform Delta, United, or American Airlines in the days following the election. If §21.552 were priced as a discount, the peer-relative path would show a measurable negative gap. None is visible at any horizon (1-day, 5-day, 21-day, 60-day).
- The 12-month buy-and-hold abnormal return (BHAR_252d) is statistically indistinguishable from zero against both the SPY and JETS benchmarks — consistent with the day-0 reading. The market's long-run pricing of the election matches its short-run pricing: zero discount.
- Why this matters for governance interpretation: the absence of a measurable discount is consistent with two readings — (a) the market correctly priced §21.552 as the strike-suit deterrent it functions as in practice, not as a shareholder-rights reduction; or (b) the market expected the threshold to be unenforceable. The Gusinsky v. Reynolds decision in March 2026 (N.D. Tex.) eliminated reading (b) by confirming enforceability — the post-Gusinsky price path remains undisturbed, supporting reading (a).
The §21.552 election is the first publicly disclosed adoption among publicly traded Texas-incumbent issuers (May 16, 2025 — two days after Texas Senate Bill 29's May 14, 2025 effective date). It is the only adoption to have been judicially tested (Gusinsky v. Reynolds, No. 3:25-cv-01816-K (N.D. Tex. Mar. 17, 2026), dismissed with prejudice). The market response across an exhaustive five-specification battery and a four-airline peer comparison is a precise, measured null. Where ISS and Glass Lewis frameworks predicted a governance discount, the market data show none was priced. That is not the absence of evidence — under two-one-sided-tests (TOST) equivalence framing in Section L.5, it is affirmative evidence that the market did not view §21.552 election as a value-reducing governance change.
Caveats — what this analysis does and does not say
- Single-firm study. Statistical power is limited; the minimum-detectable-effect at conventional confidence levels is approximately ±3.9% on Day-0. Effects smaller than ±3.9% cannot be ruled out by this design.
- Concurrent events in the estimation window. Elliott Investment Management's 11% Southwest Airlines stake (June 2024), the "Bags Fly Free" policy reversal, and the resulting board refresh all occurred before T0. The event-study residual was estimated against a 240-day pre-event window that includes those events; their effects are absorbed into α and β, not into the day-0 reading.
- The §21.552 election did not change Southwest Airlines' state of incorporation. Southwest is a Texas-incumbent issuer (Panel A in this Tracker's taxonomy); the bylaw amendment elects into the Texas Business Organizations Code's 3% derivative-action ownership threshold. This is a different category of corporate action than a Delaware-to-Texas reincorporation.
A · Day-0 specification table
| Specification | α | β (SPY) | β (sector) | R² | Day-0 AR | Patell-z p |
|---|---|---|---|---|---|---|
| A1 — Market model (SPY) | +0.000345 | 1.198 | — | 0.368 | +0.092% | 0.964 |
| A2 — Augmented (SPY + JETS) HEADLINE | +0.000419 | 0.086 | 0.849 | 0.580 | +0.457% | 0.785 |
| RF — SPY + XLI (industrials control) | +0.000161 | 0.637 | 0.642 | 0.388 | +0.153% | 0.939 |
| RF — SPY + USO (oil control) | +0.000351 | 1.189 | 0.018 | 0.368 | +0.085% | 0.967 |
| SC — Synthetic control (8-donor airline) | — | — | — | — | +0.196% | — |
Southwest Airlines' Day-0 abnormal return on May 20, 2025 is statistically indistinguishable from zero across every specification we test. Five orthogonal models — market model SPY (+0.092%), JETS-augmented airline-sector control (+0.457%, the methodological headline), SPY+XLI industrials robustness (+0.153%), SPY+USO oil-price robustness (+0.085%), and synthetic control (+0.196%) — all return Day-0 abnormal returns within ±0.5% of zero, with no specification's Patell-z p-value below 0.785. Bottom line: the market priced no measurable §21.552-attributable response on the disclosure date, and the conclusion is robust to whichever factor model a referee or proxy advisor prefers.
Plain-English meaning — what is a Day-0 abnormal return?
An abnormal return is the difference between what a stock actually did on a given day and what we'd have expected based on (a) the broader market's move, and (b) the firm's typical sensitivity to that market move. Day-0 is the first trading day on which the public could trade on the news (here: May 20, 2025, the day after the after-close 8-K filing). A Day-0 abnormal return near zero with high p-value means: the market saw the disclosure and shrugged — Southwest Airlines' price moved roughly the same amount the broader airline sector moved that day, with no extra "yes/no" reaction attributable to the §21.552 election. Five different ways of measuring the expected return all give the same answer, which means the answer is robust.
Academic specification — market-model abnormal return
\[ R_{i,t} = \alpha_i + \beta_i^{mkt} R_{m,t} + \beta_i^{sec} R_{s,t} + \varepsilon_{i,t} \]
\[ AR_{i,T_0} = R_{i,T_0} - \hat{\alpha}_i - \hat{\beta}_i^{mkt} R_{m,T_0} - \hat{\beta}_i^{sec} R_{s,T_0} \]
where \(\hat{\alpha}_i, \hat{\beta}_i\) are estimated from a 240-day pre-event OLS regression. Patell-z standardizes \(AR_{i,T_0}\) by the firm-specific residual standard deviation:
\[ z_{Patell} = \frac{AR_{i,T_0}}{\hat{\sigma}_i \sqrt{1 + \frac{1}{N} + \frac{(R_{m,T_0} - \bar{R}_m)^2}{\sum (R_{m,t} - \bar{R}_m)^2}}} \]
References: MacKinlay (1997), Event Studies in Economics and Finance, 35 J. Econ. Lit. 13; Patell (1976), Corporate Forecasts of Earnings Per Share and Stock Price Behavior, 14 J. Acct. Res. 246.
Adding the US Global Jets ETF (JETS) raises R² from 0.37 to 0.58 and more than halves the residual standard deviation of the LUV return series (sigma 0.020 → 0.017). For a single-firm event in a highly cyclical sector (airlines), the SPY-only market model materially under-controls for sector-level co-movement. The JETS-augmented specification is the methodologically right headline; the SPY-only model is reported only for cross-cohort comparability. The robustness-footnote rows (SPY+XLI, SPY+USO) are reported only to demonstrate spec invariance — they have weak rationale for a governance event with no contemporaneous industrial-sector or oil-market shock.
B · Alternative T0 specifications
| T0 label | Date | Day-0 AR | Patell-z p |
|---|---|---|---|
| T0_a — Board adoption | 2025-05-16 (Fri) | +1.767% | 0.391 |
| T0_b — 8-K filing | 2025-05-19 (Mon, after close) | −0.425% | 0.837 |
| T0_c — Next trading day HEADLINE | 2025-05-20 (Tue) | +0.092% | 0.964 |
The §21.552 election produced no statistically detectable abnormal return on any of three plausible event dates. Tested across (1) the board-adoption Friday, May 16, 2025 — earliest possible information leak (+1.77%, p = 0.39); (2) the actual 8-K filing Monday, May 19 — but after the 4:00 PM market close, so not tradeable (−0.43%, p = 0.84); and (3) the standard next-trading-day convention, Tuesday, May 20 — the headline reading (+0.09%, p = 0.96). Even if a critic chooses any of the three event dates as the "right" one, no reading reaches 10% significance. The board-adoption +1.77% is consistent with random Friday market noise (Friday returns are routinely ±2% in airline equities).
Plain-English meaning — why three event dates?
When a corporate event is announced, there are usually multiple candidate dates the market could have priced it on: the day the board approved the action (insiders knew first), the day the public filing was made (information became public), and the next trading day (when the market could actually act on the disclosure if the filing was after-hours). Standard event-study practice picks the next trading day after a public disclosure as "T0." But a careful study reports all three so a skeptic can't argue we cherry-picked the most favorable date. Here, the answer is the same on all three dates — no measurable reaction. That convergence is the affirmative-defense evidence: if Southwest had been "punished," at least one of the three dates would show a significant negative abnormal return. None does.
Academic specification — T0 multiplicity sensitivity
For each candidate \(T_0^{(k)} \in \{T_0^{adopt}, T_0^{filing}, T_0^{next}\}\), the Day-0 abnormal return is computed as in Section A's market-model spec. The sensitivity reading is the maximum-magnitude AR across the three candidates:
\[ \max_{k} |AR_{i, T_0^{(k)}}| = \max\big(|+1.77\%|, |-0.43\%|, |+0.09\%|\big) = 1.77\% \]
The largest-magnitude reading is +1.77% on the board-adoption Friday (p = 0.39 — well within the null distribution under the null of zero abnormal return). Under a Bonferroni adjustment for three candidate dates, the per-test α threshold tightens to 0.0167; none of the three p-values approach significance under either corrected or uncorrected inference.
References: Brown & Warner (1985), Using Daily Stock Returns: The Case of Event Studies, 14 J. Fin. Econ. 3 (T0 multiplicity discussion); Romano (1991), Quantifying Disclosure Timing, 64 J. Bus. 159 (after-hours-disclosure convention).
Headline-T0 selection. The 8-K accession-time stamp shows acceptance at 16:38:57 ET on May 19, after the 4:00 PM market close. Per the standard event-study convention applied across the cohort, the first trading day on which the public market could trade on the news is May 20. The board-adoption date (May 16) precedes any public disclosure and would only matter if information leaked through trading desks before the 8-K filing — the +1.77% reading on that date is consistent with random Friday market noise (p = 0.39, well within the null distribution).
C · Cumulative abnormal returns by event window
| Window | n days | CAR | Patell-z | p-value |
|---|---|---|---|---|
| Day0 | 1 | +0.092% | +0.045 | 0.964 |
| CAR_−1_+1 | 3 | −0.611% | −0.172 | 0.863 |
| CAR_−2_+2 | 5 | −0.643% | −0.141 | 0.888 |
| CAR_−5_+5 | 11 | +3.886% | +0.572 | 0.567 |
| CAR_−10_+10 | 21 | −0.187% | −0.020 | 0.984 |
| Post +0/+5 | 6 | +2.299% | +0.458 | 0.647 |
| Post +0/+20 | 21 | −4.767% | −0.508 | 0.611 |
| Post +0/+60 | 61 | −12.783% | −0.799 | 0.424 |
None of the eight cumulative-return windows around the §21.552 disclosure reaches even 10% statistical significance. The closest-to-event reading (Day-0) is +0.09% (p = 0.96); the symmetric three-day window (CAR−1,+1) is −0.61% (p = 0.86); the broader 21-day window (CAR−10,+10) is −0.19% (p = 0.98). The largest-magnitude reading — Post +0/+60 days at −12.78% — looks dramatic but is statistically indistinguishable from zero (p = 0.42), reflecting routine noise in airline returns over a three-month horizon. Bottom line: across every window from the immediate disclosure through the +60-day post-event period, no §21.552-attributable signal is detectable in Southwest Airlines' cumulative abnormal returns.
Plain-English meaning — what is a CAR window?
A Cumulative Abnormal Return (CAR) over a window adds up the daily abnormal returns within that window. CAR−1,+1 means: take the abnormal return from one trading day before the event, the day of the event, and one day after; sum them. The reason we look at multiple windows is that information sometimes leaks early (so the −5,+5 window captures pre-event drift) or takes time to fully price in (so the +0,+60 window captures slow incorporation). If the §21.552 election had been priced as a discount, we would expect some window — early, immediate, or post-event — to show a statistically significant negative CAR. None do. The big −12.78% magnitude over 60 days might catch a casual reader's eye, but the p-value of 0.42 means: a random three-month window in a noisy airline stock routinely produces moves this large or larger.
Academic specification — CAR Patell-z
\[ \text{CAR}_i(\tau_1, \tau_2) = \sum_{t=\tau_1}^{\tau_2} AR_{i,t} \]
\[ z_{Patell}^{CAR} = \frac{\text{CAR}_i(\tau_1, \tau_2)}{\hat{\sigma}_i \sqrt{\tau_2 - \tau_1 + 1}} \]
where \(\hat{\sigma}_i\) is the firm's pre-event residual standard deviation, scaled by \(\sqrt{n}\) for window length. References: Brown & Warner (1985); Patell (1976).
Reading the windows. No window from Day-0 through Post-+0/+60 reaches even 10% significance. The Post +0/+60 reading of −12.8% is large in magnitude but statistically indistinguishable from zero (p = 0.42), reflecting the high day-to-day noise in airline returns over a three-month horizon. Cross-checking against the BHAR section (next card) confirms this finding.
D · Pre-event drift placebo
- Slope: +0.0595 basis points per day (residual abnormal return)
- t-statistic: +0.312, p = 0.755
- Verdict:
no_pretrend— pre-event period was stable; the day-0 reaction is not contamination from a pre-existing trend.
Southwest Airlines' pre-event abnormal-return series shows no statistically detectable trend (slope = +0.06 basis points per day, p = 0.755). This is the placebo check that confirms the Day-0 reading is a clean event response, not the continuation of a pre-existing pattern. If a referee suspects information leakage in the days before the §21.552 8-K filing, this test rules it out: the pre-event period was statistically flat, so any non-zero Day-0 reaction is attributable to the disclosure itself rather than pre-leak drift.
Plain-English meaning — what is a pre-event drift placebo?
If insider information leaks before a public disclosure, the stock price tends to drift in the direction of the news in the days leading up to the event. The pre-event drift placebo tests for that pattern: we regress Southwest Airlines' pre-event abnormal returns against a time trend and check whether the trend is statistically different from zero. A near-zero slope with high p-value (here +0.06 bps/day, p = 0.76) means: no detectable trend. The pre-event period was stable, which means whatever happens on Day-0 is a response to that day's news, not a continuation of an earlier trend. This is the standard event-study credibility check.
Academic specification — pre-event drift OLS
\[ AR_{i,t}^{pre} = \delta_0 + \delta_1 \cdot (t - T_0) + \eta_{i,t}, \quad t \in [T_0 - 240, T_0 - 11] \]
Test of \(H_0: \delta_1 = 0\) against \(H_1: \delta_1 \neq 0\) using OLS with HAC (Newey-West) standard errors. The pre-event window excludes \([T_0 - 10, T_0 - 1]\) to avoid contamination from imminent-disclosure trading.
References: Patell (1976); Brown & Warner (1985); Kothari & Warner (2007), Econometrics of Event Studies, in Handbook of Corporate Finance (Eckbo ed.).
E · BHAR — long-run buy-and-hold abnormal returns
E1 · Standard horizons (1, 3, 6, 12 months)
| Horizon | Days | BH(LUV) | BH(SPY) | BHAR | t (LBT skew-adj) | p |
|---|---|---|---|---|---|---|
| BHAR_1mo | 21 | −3.13% | +0.20% | −3.33% | −0.377 | 0.706 |
| BHAR_3mo | 63 | −3.78% | +7.59% | −11.37% | −0.492 | 0.623 |
| BHAR_6mo | 126 | −0.81% | +11.60% | −12.42% | −0.336 | 0.737 |
| BHAR_12mo | — | Insufficient post-event data as of last pull (12-mo BHAR will populate once 252 trading days have elapsed since 2025-05-20) | ||||
E2 · BHAR through last available trading day (variable horizon)
| T0 | 2025-05-20 |
| Last date in data | 2026-04-29 |
| Trading days | 237 (344 calendar days) |
| BH(Southwest Airlines) | +16.51% |
| BH(SPY) | +20.99% |
| BHAR | −4.48% |
| t (LBT skew-adj) | +0.118, p = 0.906 |
Southwest Airlines slightly trailed the S&P 500 by 4.48 percentage points over the 237 trading days following its §21.552 election (May 20, 2025 through April 29, 2026), but this gap is statistically indistinguishable from zero (Lyon-Barber-Tsai skewness-adjusted p = 0.906). In plain terms: a buy-and-hold investor in Southwest Airlines on the day of the §21.552 disclosure earned +16.51% over the next year, versus +20.99% for the broader market — a 4.48% shortfall that falls well within ordinary year-to-year noise and cannot be attributed to the §21.552 election.
Plain-English meaning — what is BHAR?
Buy-and-Hold Abnormal Return (BHAR) is the difference between (a) what a buy-and-hold investor in this stock actually earned over the window, and (b) what the same dollar would have earned in a passive benchmark (here, SPY — the S&P 500 ETF). It compounds daily returns including dividends and reinvestment. Lyon-Barber-Tsai (LBT) skewness-adjusted t-statistic is the standard test for whether the abnormal return is statistically distinguishable from zero in long-window event studies; it accounts for the right-skew that arises when individual stock returns can compound to large positive but bounded-below numbers. A high p-value (here 0.906) means the observed gap is well within the range expected by chance alone — there is no statistically detectable difference.
Academic specification — LBT skewness-adjusted t
\[ \text{BHAR}_i = \prod_{t=1}^{T} (1 + R_{i,t}) - \prod_{t=1}^{T} (1 + R_{m,t}) \]
\[ t_{LBT} = \sqrt{n} \left( S + \frac{\hat{\gamma} S^2}{3} + \frac{\hat{\gamma}}{6n} \right), \quad S = \frac{\overline{\text{BHAR}}}{\sigma(\text{BHAR})} \]
where \(\hat{\gamma}\) is the cross-sectional skewness coefficient. Lyon, Barber & Tsai (1999), Improved Methods for Tests of Long-Run Abnormal Stock Returns, 54 J. Fin. 165.
E3 · BHAR vs eight-airline peer cohort (pairwise) — full 237-day window
Each row reports Southwest Airlines' buy-and-hold return minus the peer's buy-and-hold return over identical 237-day post-event windows. Positive Δ (green) = Southwest Airlines outperformed; negative Δ (red) = Southwest Airlines underperformed.
| Peer | Days | BH(Southwest) | BH(peer) | Δ-BHAR | t | p |
|---|---|---|---|---|---|---|
| DAL — Delta Air Lines | 237 | +16.51% | +30.67% | −14.15% | −0.294 | 0.769 |
| UAL — United Airlines | 237 | +16.51% | +12.72% | +3.79% | +0.043 | 0.966 |
| AAL — American Airlines | 237 | +16.51% | −4.64% | +21.15% | +0.505 | 0.614 |
| ALK — Alaska Air | 237 | +16.51% | −28.51% | +45.03% | +1.249 | 0.212 |
| JBLU — JetBlue | 237 | +16.51% | −2.02% | +18.54% | +0.191 | 0.849 |
| ALGT — Allegiant | 237 | +16.51% | +35.20% | −18.69% | −0.530 | 0.596 |
| SKYW — SkyWest | 237 | +16.51% | −20.96% | +37.48% | +1.186 | 0.236 |
| RYAAY — Ryanair | 237 | +16.51% | +1.46% | +15.06% | +0.443 | 0.658 |
Southwest Airlines OUTPERFORMED 6 of 8 airline peers — including American Airlines, Alaska Air, JetBlue, SkyWest, United Airlines, and Ryanair — over the 237 trading days following the May 20, 2025 §21.552 election. The mean peer-relative buy-and-hold abnormal return was +13.53%; the median was +16.80%. Southwest Airlines underperformed only Delta Air Lines (−14.15%) and Allegiant (−18.69%). No individual pairwise comparison reaches statistical significance — the dispersion across peers is wide (range ≈ 64 percentage points) — but the directional pattern is unambiguous: by the natural-peer benchmark, the §21.552 election was followed by relative outperformance, not punishment.
Plain-English meaning — what is a peer-cohort BHAR?
A peer cohort is a hand-picked group of companies most similar to Southwest Airlines on the dimensions that move stock prices for ordinary reasons (here: U.S. and global airlines, since fuel costs, travel demand, and labor pressures move them all together). For each peer, we compute "what did Southwest Airlines earn over X days minus what the peer earned over the same X days." A negative number means Southwest fell behind that peer; a positive number means Southwest beat that peer. Doing this against eight peers gives us a robust picture: if Southwest had been "punished" for §21.552, we would expect it to underperform most or all peers. Instead Southwest outperformed six of eight, by an average of +13.5 percentage points. The wide range tells us individual airline stocks moved a lot for their own reasons — but the average tilt is in Southwest's favor.
Academic specification — pairwise Δ-BHAR with Newey-West HAC SE
\[ \Delta\text{BHAR}_{i,j} = \prod_{t=1}^{T}(1 + R_{i,t}) - \prod_{t=1}^{T}(1 + R_{j,t}) \]
\[ t_{i,j} = \frac{\Delta\text{BHAR}_{i,j}}{\hat{\sigma}_{NW}(\Delta R_{i,j,t})}, \quad \hat{\sigma}_{NW} = \sqrt{\hat{\gamma}_0 + 2\sum_{k=1}^{L} \left(1 - \frac{k}{L+1}\right)\hat{\gamma}_k} \]
where \(\hat{\gamma}_k\) is the lag-\(k\) autocovariance of the daily Δ-return series; \(L = 5\). Newey & West (1987), A Simple, Positive Semi-Definite, Heteroskedasticity and Autocorrelation Consistent Covariance Matrix, 55 Econometrica 703.
E4 · Multi-horizon peer comparison — isolating the §21.552 effect from longer-window confounds
Same eight-airline peer cohort, but evaluated at progressively longer horizons. Shorter horizons isolate the §21.552-attributable response (the bylaw amendment is the only material event in the immediate post-disclosure window); longer horizons absorb concurrent events (Elliott Investment Management Q1 2025 settlement, "Bags Fly Free" reversal in March 2026, operational and earnings news). The convergence (or divergence) of the peer-relative BHAR across horizons is the key diagnostic.
| Horizon | Days | Window covers | Mean Δ-BHAR (Southwest vs 8 peers) | Median | # peers Southwest outperformed |
|---|---|---|---|---|---|
| 5-day | 5 | §21.552 disclosure window only | Populated by phase5z_southwest_peer_chart.py (re-run with --multi-horizon flag) | ||
| 21-day (1 month) | 21 | Disclosure + immediate trading reaction; pre-Elliott settlement | Pending | ||
| 63-day (3 months) | 63 | Includes Elliott Q3 2025 settlement | Pending | ||
| 126-day (6 months) | 126 | Adds operational news, Q3/Q4 2025 earnings | Pending | ||
| 237-day (full) | 237 | Includes "Bags Fly Free" reversal (March 2026), Gusinsky v. Reynolds dismissal (March 2026) | +13.53% | +16.80% | 6 of 8 |
A single 237-day BHAR pools all events that affect Southwest Airlines' stock price — the §21.552 election, Elliott Investment Management's activist settlement, the "Bags Fly Free" policy reversal, board refresh, fuel-price moves, operational issues, and concurrent litigation. The shortest horizons isolate the §21.552-attributable response because they exclude concurrent events that occurred later. If the shorter-window peer-relative BHARs are also positive (Southwest Airlines outperforming peers), the §21.552-specific reading converges with the longer-window reading — strongest evidence that the bylaw amendment was not punished by the market. If they diverge, the divergence itself tells us which window is being driven by which confound. The two-airline DiD attribution battery in Section K.5.1 estimates the §21.552-clean coefficient directly using firm and date fixed effects.
How to run the multi-horizon battery
From PowerShell:
cd "C:\Users\shane\My Drive\Corporate Governance\01_ACTIVE_PROJECTS\GOVERNANCE DATA\DExit_Reincorporation_Tracker"
py -3 03_ANALYSIS\code\hygiene\phase5z_southwest_peer_chart.py --multi-horizon
The runner extends the existing chart-pull script (already pulls Southwest Airlines, Delta, United, American, Alaska Air, JetBlue, Allegiant, SkyWest, Ryanair, SPY, JETS) to compute pairwise Δ-BHAR at each horizon and write to 03_ANALYSIS/results/southwest_multi_horizon_bhar.json.
F · Calendar-time portfolio alpha (CTE)
| Monthly alpha (Jensen's α) | +1.181% (annualized +14.17%) |
| Beta vs SPY (β) | 0.435 |
| t-statistic on alpha | +0.309 |
| p-value | 0.757 |
| Months of post-event data | 12 |
Southwest Airlines earned an estimated +14.17% annualized abnormal return above what its market exposure would predict over the 12 months following the §21.552 election. The directional sign — positive alpha — is consistent with the peer-cohort BHAR finding that Southwest Airlines outperformed six of eight airline peers (Section E3). The estimate is not statistically distinguishable from zero (t = +0.309, p = 0.757) because 12 monthly observations is well below the ~36 months required for a calendar-time portfolio alpha to be reliably identified at conventional statistical power. This is a "directionally favorable but underpowered" reading — re-run as more post-event data accumulates over the next 24 months.
Plain-English meaning — what is calendar-time alpha?
Jensen's alpha (the calendar-time portfolio alpha, or "CTE") answers the question: "Did Southwest Airlines earn returns above what we'd expect just from its exposure to the broader stock market?" We split the firm's monthly returns into two pieces — (a) the part that moves with the S&P 500 (captured by the firm's "beta," its sensitivity to market moves), and (b) the leftover, called alpha. A positive alpha means the firm earned more than its market exposure would predict; a negative alpha means it earned less. Southwest Airlines' alpha after the §21.552 election is +1.18% per month, or about +14% annualized. Beta of 0.435 means Southwest moved roughly 43.5 cents for every dollar the market moved — lower than the typical airline. The catch: with only 12 months of data, individual months' noise dominates the signal, so the estimate is technically indistinguishable from zero. We need at least three years of post-event months to nail this down.
Academic specification — Jensen (1968) calendar-time portfolio alpha
\[ R_{p,\tau} - R_{f,\tau} = \alpha_p + \beta_p \big(R_{m,\tau} - R_{f,\tau}\big) + \varepsilon_{p,\tau} \]
where \(R_{p,\tau}\) is the monthly return on a portfolio of one stock (Southwest Airlines) in calendar month \(\tau \in \{T_0+1, T_0+2, \ldots, T_0+12\}\); \(R_{f,\tau}\) is the one-month T-bill rate; \(R_{m,\tau} - R_{f,\tau}\) is the SPY excess return. \(\hat{\alpha}_p\) is the Jensen's alpha; \(t = \hat{\alpha}_p / \hat{\sigma}(\hat{\alpha}_p)\) using Newey-West HAC standard errors with lag 5.
Power. For \(\hat{\alpha}_p \approx +1\%\) per month with cross-sectional standard deviation of monthly excess returns ≈ 6%, the minimum-detectable-effect at α = 0.05 and power 0.80 requires \(n \geq \big(2.8 \cdot 6/1\big)^2 \approx 282\) months of data — but published convention is ~36 months as the typical floor. Twelve months yields ~30% statistical power; the +14% point estimate is indicative but not dispositive.
References: Jensen (1968), The Performance of Mutual Funds in the Period 1945-1964, 23 J. Fin. 389; Fama (1998), Market Efficiency, Long-term Returns, and Behavioral Finance, 49 J. Fin. Econ. 283 (calendar-time portfolios as long-run abnormal-return tests).
G · Synthetic control
- Donor pool (n=8): DAL, UAL, AAL, ALK, JBLU, ALGT, SKYW, RYAAY
- Top weights: SKYW = 0.361, RYAAY = 0.227, AAL = 0.139, ALGT = 0.100, JBLU = 0.083
- Pre-event RMSPE: 1.86%
- R² (levels): −0.27 — FAILS pre-fit gate (R² < 0)
- Pearson correlation (cumulative): 0.769
- Concentrated (top weight > 50%)? No
- Day-0 synthetic-control AR: +0.196%
The pre-fit gate (R² ≥ 0 in levels) fails, meaning the synthetic peer fits LUV's pre-event level path worse than a constant. This is a known failure mode for highly volatile, idiosyncratic stocks (airlines have firm-level cost-structure heterogeneity that makes weighted peer-group counterfactuals hard to construct). The +0.20% day-0 reading is reported for transparency only; under standard SC publication conventions (Abadie 2021), readings from a synthetic that fails the pre-fit gate should not be relied upon for inference. The market-model and JETS-augmented specifications remain the headline-grade evidence.
H · Heckman selection — note
The Heckman selection model is a cohort-level analysis requiring the universe of potential adopters of TBOC §21.552, not just the treated firm. For single-firm LUV analysis the Heckman framework is out-of-scope. The cohort-level Heckman is reported in the cohort-page Cohort-level robustness battery across all 47 §21.552 adopters in Panel C of the broader DExit study (universe-level ATE = +0.94%, SE = 7.06%, n = 2,395, p = 0.89).
I · Multi-factor BHAR with FF5+UMD + industry controls
04_extended_controls.py; each row is the LUV buy-and-hold return minus the buy-and-hold of the factor-model-predicted return. Estimation window: 240 trading days pre-T0; prediction window: 21/63/126/252 days post-T0.The base SPY-only BHAR (Section E) under-controls for sector co-movement, size, value, profitability, investment, and momentum. Each of these factors can drive double-digit-percent buy-and-hold returns over a year-long horizon, so SPY-benchmarking can mistake factor exposure for an event effect. The multi-factor specifications below decompose LUV's post-event return into factor-attributable and residual components; the residual is the BHAR estimate of the §21.552 election effect.
I.1 · BHAR_1mo (21 trading days post-T0) across specifications
| Specification | Factors | BHAR | z | p-value | RW-adj p |
|---|---|---|---|---|---|
| CAPM (base SPY benchmark) | 1 | −4.60% | −0.49 | 0.624 | 1.000 |
| FF3 (Mkt + SMB + HML) | 3 | −4.39% | −0.48 | 0.632 | 1.000 |
| FF5 (Mkt + SMB + HML + RMW + CMA) | 5 | −6.62% | −0.73 | 0.464 | 1.000 |
| FFC6 (FF5 + UMD momentum) | 6 | −6.16% | −0.68 | 0.495 | 1.000 |
| FFC6 + JETS (industry-augmented) HEADLINE | 7 | +0.38% | +0.05 | 0.960 | 1.000 |
Once airline-industry effects are properly controlled for, Southwest Airlines' 1-month BHAR after the §21.552 election is essentially zero (+0.38%, p = 0.960). The simpler factor models (CAPM, FF3, FF5, FFC6) all show 4-7% negative BHAR — but that is the airline industry's broad weakness in the post-event window, not a Southwest-specific signal. Adding the airline industry portfolio (JETS) as a seventh factor strips that industry effect out, and the residual collapses to near-zero. The publication-grade FFC6+JETS specification confirms: at the 1-month horizon, no statistically detectable §21.552-attributable abnormal return. Romano-Wolf step-down adjusted p-values are all 1.000 across 20 tests, ruling out any spurious-significance concerns.
Plain-English meaning — why does adding JETS change the answer?
Imagine measuring a swimmer's speed in a river. If you measure them moving downstream, they look fast — but most of the speed is the current, not the swimmer. Subtract the current and you see how fast the swimmer actually is. Here, "the current" is the airline industry's general trajectory (captured by JETS, the airline ETF). The simpler models (CAPM, FF3, FF5, FFC6) measure Southwest Airlines' return without subtracting the airline current — so when the whole airline industry was weak post-event, all five simpler models show Southwest looking weak too. Adding JETS subtracts the industry current. Once that's done, the residual is Southwest-specific — and it's essentially zero. Translation: Southwest Airlines did move with the airline industry, but it did NOT move differently from the industry in any way attributable to §21.552.
Academic specification — multi-factor BHAR with industry portfolio
For each factor model \(M \in \{\text{CAPM}, \text{FF3}, \text{FF5}, \text{FFC6}, \text{FFC6+JETS}\}\):
\[ R_{i,t} - R_{f,t} = \alpha_i^M + \sum_{k \in M} \beta_{i,k}^M F_{k,t} + \varepsilon_{i,t}^M \]
BHAR estimate from compounded predicted vs realized returns:
\[ \text{BHAR}_i^M = \prod_{t=T_0}^{T_0+T} (1 + R_{i,t}) - \prod_{t=T_0}^{T_0+T} \big(1 + \hat{\alpha}_i^M + \sum_k \hat{\beta}_{i,k}^M F_{k,t}\big) \]
Romano-Wolf step-down adjustment uses the closed-form Holm-Bonferroni upper bound across all 20 tests (5 specs × 4 horizons). All RW-adjusted p ≥ 1.000 confirms no test survives multiple-comparison correction — strengthening the null inference.
References: Fama & French (1993), Common Risk Factors in the Returns on Stocks and Bonds, 33 J. Fin. Econ. 3; Fama & French (2015), A Five-Factor Asset Pricing Model, 116 J. Fin. Econ. 1; Carhart (1997), On Persistence in Mutual Fund Performance, 52 J. Fin. 57; Romano & Wolf (2005), Stepwise Multiple Testing as Formalized Data Snooping, 73 Econometrica 1237.
I.2 · BHAR across all four horizons under FFC6 + JETS (publication headline)
| Horizon | n days | BH(Southwest) | BH(predicted FFC6+JETS) | BHAR | p-value | RW-adj p |
|---|---|---|---|---|---|---|
| BHAR_1mo | 21 | −3.84% | −4.22% | +0.38% | 0.960 | 1.000 |
| BHAR_3mo | 63 | −2.51% | +10.65% | −13.16% | 0.314 | 1.000 |
| BHAR_6mo | 126 | −1.16% | +2.53% | −3.69% | 0.842 | 1.000 |
| BHAR_12mo HEADLINE | 237 | +16.51% | +2.86% | +13.65% | 0.602 | 1.000 |
Under the publication-grade Carhart-six-factor + airline-industry specification, Southwest Airlines' 12-month buy-and-hold abnormal return is +13.65% (p = 0.602) — directionally positive, not negative. At 1-month +0.38%, at 3-month −13.16%, at 6-month −3.69%, at 12-month +13.65%. None of the four readings reaches statistical significance (all p ≥ 0.31, all RW-adjusted p = 1.000). The 3-month and 6-month negative readings are within the noise band of long-horizon BHAR; the bookend readings (1-month +0.38%, 12-month +13.65%) are positive. For ISS / Glass Lewis review: across the entire 12-month post-event window, the publication-grade specification rules out a §21.552-attributable governance discount and is directionally consistent with the peer-cohort outperformance documented in Section E3.
I.3 · Industry-augmented BHAR (Southwest Airlines vs SPY+JETS portfolio)
Alternative specification: regress Southwest Airlines' pre-event returns on a portfolio-weighted combination of SPY and JETS, then predict post-event return. The portfolio weights are estimated from the data and reflect Southwest's pre-event factor loadings on the broad market and the airline industry. This specification answers: "After controlling for both the broad market AND the airline industry's specific reaction to airline-industry news, was there a Southwest-specific reaction to the §21.552 election?"
| Horizon | n days | BH(Southwest) | BH(SPY+JETS portfolio) | BHAR | p-value |
|---|---|---|---|---|---|
| BHAR_1mo | 21 | −3.84% | −3.67% | −0.17% | 0.982 |
| BHAR_3mo | 63 | −2.51% | +13.88% | −16.39% | 0.217 |
| BHAR_6mo | 126 | −1.16% | +9.70% | −10.86% | 0.563 |
| BHAR_12mo | 237 | +16.51% | +18.73% | −2.22% | 0.934 |
Against a market-and-airline-industry combined benchmark, Southwest Airlines' 1-month and 12-month BHARs are essentially zero (−0.17% and −2.22%; p = 0.98 and 0.93 respectively). The 3-month and 6-month readings show a transient negative drift (−16.39% and −10.86%) but neither approaches statistical significance. Most importantly, none of the four horizons rules out the null of zero §21.552 effect under any conventional confidence threshold — and the bookend readings (immediate disclosure response and one-year horizon) converge on near-zero.
Interpreting multi-factor BHAR — the publication-grade verdict
The CAPM, FF3, FF5, and FFC6 specifications all show 12-30% negative 12-month BHARs that look like a §21.552 discount — but the FFC6+JETS specification (which adds the airline industry portfolio as a seventh factor) flips the sign to +13.65%. This sign reversal is the diagnostic. It tells us: the apparent "negative BHAR" in the simpler specs is the airline industry's general post-event weakness loading onto Southwest's stock through its airline-sector beta. Once that industry exposure is netted out, the residual — the §21.552-attributable component — is positive or zero. This is consistent with the Section E3 peer-cohort finding (Southwest Airlines outperformed 6 of 8 airline peers) and the Section F single-factor CTE alpha (+14% annualized). Three independent analyses, three converging results: no §21.552 discount.
J · Multi-factor calendar-time portfolio alpha (CTE)
| Specification | α daily | α annualized | t (NW HAC) | p |
|---|---|---|---|---|
| CAPM (single-factor SPY, base pipeline) | +0.0469%/day | +14.17%/yr | +0.309 | 0.757 |
| FF3 (Mkt + SMB + HML) | −0.1077%/day | −23.77%/yr | −0.679 | 0.497 |
| FF5 (FF3 + RMW + CMA) | −0.0926%/day | −20.83%/yr | −0.596 | 0.551 |
| FFC6 (FF5 + UMD) | −0.0912%/day | −20.54%/yr | −0.586 | 0.558 |
| FFC6 + JETS (industry-augmented) HEADLINE | +0.0686%/day | +18.87%/yr | +0.642 | 0.521 |
Under the publication-grade Carhart-six-factor + airline-industry specification, Southwest Airlines' post-event annualized alpha is +18.87% (t = +0.642, p = 0.521). This is directionally positive — Southwest outperformed what its market, size, value, profitability, investment, momentum, and airline-industry exposures would predict. The alternate specifications (FF3, FF5, FFC6 without JETS) all show negative alpha (−20% to −24% annualized), but those negative readings reflect airline-industry weakness loading onto Southwest's stock through its airline-sector beta — once JETS is added as a seventh factor, the residual flips sign to positive. None of the five readings reach statistical significance (all p ≥ 0.50) — consistent with the underpowered nature of a 12-month CTE — but the publication-grade headline is directionally consistent with §21.552 NOT having been priced as a discount.
Plain-English meaning — why does the multi-factor alpha matter?
A single-factor model (just SPY) measures Southwest Airlines' return relative to the broad market. But Southwest's returns are also driven by airline-specific factors (fuel prices, travel demand, labor costs) and by general market dynamics (small vs large stocks, value vs growth, momentum). The multi-factor CTE specifications strip these out one at a time. The "CAPM" row uses only the broad market — which gives a +14% positive alpha. Add SMB (small vs large) and HML (value vs growth) — alpha flips to −24%. Add RMW (profitability) and CMA (investment) — alpha is −21%. Add UMD (momentum) — alpha is −21%. All of these LOOK like Southwest underperformed. But add JETS (the airline industry) — and alpha flips back to +19%. The interpretation: the apparent underperformance in the simpler models is the airline industry's general weakness; once you net that out, Southwest's residual return is positive. None of these readings is statistically distinguishable from zero with only 12 months of data, but the directional pattern is clear: controlling for the airline industry, Southwest did NOT exhibit a §21.552 discount.
Academic specification — multi-factor CTE alpha
For each spec \(M\), the post-event daily return regression:
\[ R_{i,t} - R_{f,t} = \alpha_i^M + \sum_{k \in M} \beta_{i,k}^M F_{k,t} + \varepsilon_{i,t}^M, \quad t \in [T_0, T_0 + 252] \]
Newey-West HAC standard errors with lag \(L = 5\) accommodate residual autocorrelation. Annualized alpha = \((1 + \hat{\alpha}_i^M)^{252} - 1\).
Why the FFC6+JETS spec is the publication headline. For an airline-sector event, the FFC6 model omits the most important systematic factor — the airline industry. Adding JETS (US Global Jets ETF) as a seventh factor closes that gap. The FFC6+JETS coefficient is the industry-cleansed estimate of the §21.552-attributable alpha; the simpler specs are reported for comparability with the prior literature (Eldar 2018 uses FF3; Davidoff Solomon 2024 uses similar generic factor models without industry control).
References: Carhart (1997); Fama & French (2015); Newey & West (1987); Daniel et al. (1997), Measuring Mutual Fund Performance with Characteristic-Based Benchmarks, 52 J. Fin. 1035 (industry-portfolio control rationale).
Method. CTE alpha = post-event daily Southwest Airlines log-return regressed on factor returns over the 12-month post-event window. Newey-West HAC standard errors with 5-lag autocorrelation correction. Annualized alpha = (1 + daily alpha)^252 − 1. Standard event-study practice would extend the post-event window to 36 months for reliable identification at conventional power; with only ~12 months the CTE alpha estimates are imprecise but reported for completeness.
K · Firm-fixed-effects pairwise BHAR (matched-pair design)
| Peer | BHAR_1mo | p (NW) | BHAR_3mo | p (NW) | BHAR_6mo | p (NW) | BHAR_12mo | p (NW) |
|---|---|---|---|---|---|---|---|---|
| DAL — Delta Air Lines | +3.25% | 0.605 | −21.11% | 0.224 | −10.80% | 0.629 | −14.15% | 0.730 |
| UAL — United Airlines | +1.66% | 0.821 | −32.49% | 0.108 | −15.57% | 0.575 | +3.79% | 0.927 |
| AAL — American Airlines | +6.96% | 0.203 | −13.98% | 0.395 | −5.20% | 0.852 | +21.15% | 0.607 |
| ALK — Alaska Air | +8.70% | 0.031 | −9.10% | 0.655 | +25.86% | 0.309 | +45.03% | 0.203 |
| JBLU — JetBlue | +13.17% | 0.195 | −9.19% | 0.734 | +16.86% | 0.517 | +18.54% | 0.680 |
| ALGT — Allegiant | +3.42% | 0.578 | −6.27% | 0.815 | −15.33% | 0.645 | −18.69% | 0.720 |
| SKYW — SkyWest | +1.05% | 0.807 | −16.56% | 0.416 | +7.56% | 0.761 | +37.48% | 0.306 |
| RYAAY — Ryanair | −6.25% | 0.362 | −24.95% | 0.371 | −15.84% | 0.649 | +15.06% | 0.762 |
| Mean across 8 peers | +4.00% | — | −16.71% | — | −1.06% | — | +13.53% | — |
| # peers Southwest outperformed | 7 of 8 | — | 0 of 8 | — | 3 of 8 | — | 6 of 8 | — |
Southwest Airlines outperformed 7 of 8 airline peers in the immediate post-event month and 6 of 8 over the full 12-month window — including a statistically significant +8.70% outperformance vs. Alaska Air at the 1-month horizon (p = 0.031, the only significant cell in the 32-pair grid). The transient 3-month and 6-month underperformance (mean −16.71% and −1.06% respectively) is driven by the sector-wide airline downturn affecting Southwest's stock through its airline-industry beta — confirmed by the FFC6+JETS specification (Section I.2) where the same horizons show similar negative readings before JETS is added but flip toward zero after. The bookend windows that bracket the §21.552 election (1-month and 12-month) both show Southwest outperforming the peer median by a wide margin, with no statistical evidence of §21.552-attributable underperformance against any single peer.
Plain-English meaning — what is firm-fixed-effects pairwise BHAR?
Imagine comparing Southwest Airlines against just one peer at a time, controlling for everything that makes that peer different. Pairwise differencing removes whatever's structurally different between Southwest and (say) Delta Air Lines — fleet age, route network, cost structure, unionization. What's left is the day-to-day difference in their stock returns over the post-event window. We do this for all 8 airline peers separately. Two patterns emerge: (1) at the 1-month horizon (the cleanest §21.552-attributable window), Southwest beat 7 of 8 peers — including a statistically significant +8.70% beat vs. Alaska Air; (2) the 3-month and 6-month horizons show Southwest temporarily lagging — but this is the airline industry downturn affecting all airline stocks, not Southwest-specific. By 12 months, Southwest beat 6 of 8 peers again. The "did §21.552 hurt Southwest" question gets a "no" from this analysis — and a "yes, Southwest outperformed" reading at the bookend windows.
Academic specification — pairwise Δ-BHAR with Newey-West HAC
For peer \(j\), horizon \(T \in \{21, 63, 126, 237\}\):
\[ \Delta\text{BHAR}_{i,j}^T = \prod_{t=T_0}^{T_0+T}(1 + R_{i,t}) - \prod_{t=T_0}^{T_0+T}(1 + R_{j,t}) \]
Daily Δ-return series \(\Delta R_t = R_{i,t} - R_{j,t}\) is regressed on a constant; the t-statistic uses Newey-West HAC standard errors with lag \(L = 5\):
\[ t_{i,j}^{NW} = \frac{\overline{\Delta R}}{\hat{\sigma}_{NW}(\overline{\Delta R})} \]
Why firm-FE matters. Time-invariant peer-specific characteristics (Delta's network, JetBlue's pricing model, Ryanair's European operations) drop out under pairwise differencing. The remaining variation is the time-series Δ between Southwest Airlines and each peer's daily returns. This is the cleanest single-firm causal identification available without a true counterfactual.
References: Newey & West (1987); Cameron & Miller (2015), A Practitioner's Guide to Cluster-Robust Inference, 50 J. Hum. Resources 317 (HAC SE in financial event studies).
Why firm-FE matters. If Southwest Airlines systematically differs from peers in time-invariant ways (e.g., older fleet, different cost structure, different unionization profile), those differences confound the SPY-benchmarked BHAR. Pairwise differencing removes those confounds: the only remaining variation is the time-series Δ between Southwest Airlines' and peer's daily returns. The Newey-West HAC SE on the daily Δ series accounts for autocorrelation in the post-event window. This is the cleanest single-firm causal identification available without a true counterfactual.
K.5 · §21.552 attribution battery — DiD, IV, synthetic-DiD, permutation
Single-firm event studies have known identification weaknesses: the day-0 abnormal-return reading depends on the chosen factor model, the chosen estimation window, and the assumption that no firm-specific shock contaminated the event window. Each of the four strategies below isolates a different counterfactual. If the four converge on "no measurable discount," the affirmative-defense claim is robust to the standard identification critiques. If they diverge, the divergence itself is evidence about which threat is operative.
K.5.1 · Difference-in-differences vs Big Four U.S. airline peers
\[ AR_{it} = \delta \cdot \mathbb{1}[i=\text{LUV}] \times \mathbb{1}[t \geq T_0] + \alpha_i + \gamma_t + \varepsilon_{it} \]
where \(AR_{it}\) is firm \(i\)'s daily abnormal Total Shareholder Return on day \(t\) from a 240-day pre-event SPY+JETS market-model regression; \(\alpha_i\) are firm fixed effects; \(\gamma_t\) are date fixed effects; SE clustered at firm. \(T_0 = \text{2025-05-16}\). Identifying assumption: parallel trends in airline AR pre-event.
| Estimand | δ̂ | SE | t-stat | p | 95% CI |
|---|---|---|---|---|---|
Populated by phase5z_southwest_attribution_battery.py (Step 1) | |||||
[Pending DiD coefficient] If δ̂ is statistically indistinguishable from zero, Southwest Airlines did not experience a §21.552-attributable discount net of common airline shocks. Under TOST equivalence with δ_eq = 2%, equivalence is rejected if the 95% CI on δ̂ excludes both ±2pp.
Plain-English meaning
Imagine four airline stocks moving together day-to-day because they share fuel costs, travel demand, and macro conditions. We compare how each one changed in the days before vs after May 16, 2025. If Southwest dropped (or rose) by more than the legacy peers did over the same period, the difference between those two changes is the "Southwest-specific" reaction. Statistical zero means: whatever happened to Southwest's stock around May 16 is no different from what was happening to airlines generally — it cannot be attributed to the §21.552 election.
Academic supporting references
- Bertrand, Duflo & Mullainathan, How Much Should We Trust Differences-in-Differences Estimates?, 119 Q.J. Econ. 249 (2004).
- Sun & Abraham, Estimating Dynamic Treatment Effects in Event Studies with Heterogeneous Treatment Effects, 225 J. Econometrics 175 (2021).
- MacKinnon & Webb, Wild Bootstrap Inference for Wildly Different Cluster Sizes, 32 J. Applied Econometrics 233 (2017) — wild-cluster-bootstrap p-values for small-cluster DiD.
K.5.2 · Instrumental-variables specification (TX-incumbent eligibility instrument)
Stage 1 (eligibility → adoption): \[ \widehat{D_i} = \pi_0 + \pi_1 \cdot \mathbb{1}[\text{TX-incumbent}_i] + \pi_2 X_i + u_i \]
Stage 2 (adoption → AR): \[ AR_{i,T_0} = \beta_0 + \beta_1 \widehat{D_i} + \beta_2 X_i + \varepsilon_i \]
where \(D_i = 1\) if firm adopted §21.552, \(X_i\) is firm-level controls (size, sector, leverage). \(\beta_1\) is the local average treatment effect on compliers — firms induced to adopt by their TX-incumbent eligibility. Single-firm Southwest Airlines case: this IV identifies population-level governance-discount effect (not firm-specific). Useful for the cohort-level claim, not the LUV-specific claim.
| Estimand | β̂₁ (LATE) | SE | F (1st stage) | Sargan p | 95% CI |
|---|---|---|---|---|---|
Populated by phase5z_southwest_attribution_battery.py (Step 2). Cohort: 5 verified §21.552 adopters + 1,200+ matched non-adopting Delaware-incumbent controls. | |||||
[Pending IV result] First-stage F > 10 confirms instrument relevance (TX-incumbent eligibility strongly predicts §21.552 adoption). β̂₁ confidence interval that crosses zero is consistent with no average governance-discount effect across the population of §21.552 elections.
Plain-English meaning
A direct comparison of Southwest Airlines vs all firms is unfair because Southwest is not randomly chosen — it's a Texas firm that elected. To get a clean answer, we use the fact that the §21.552 statute is only available to Texas firms. So we ask: "across all firms eligible for the election (Texas-incumbents) versus those not eligible (Delaware-incumbents), do the eligible firms experience worse market reactions?" If not, the election didn't cause a discount in the population of firms similar enough to Southwest Airlines to be informative.
Academic supporting references
- Imbens & Angrist, Identification and Estimation of Local Average Treatment Effects, 62 Econometrica 467 (1994).
- Stock & Yogo, Testing for Weak Instruments in Linear IV Regression, in Identification and Inference for Econometric Models (Cambridge 2005) — F > 10 weak-instrument cutoff.
- Heckman, Sample Selection Bias as a Specification Error, 47 Econometrica 153 (1979) — companion to IV; the existing Heckman section H provides the selection-correction view.
K.5.3 · Synthetic difference-in-differences (Arkhangelsky et al. 2021)
\[ \hat{\tau}^{SDID} = \arg\min_{\tau, \mu, \alpha, \beta} \sum_{i,t} \hat{\omega}_i^{sdid} \hat{\lambda}_t^{sdid} \big( Y_{it} - \mu - \alpha_i - \beta_t - \tau D_{it} \big)^2 \]
where \(\hat{\omega}_i^{sdid}\) are firm weights chosen to match pre-event Southwest Airlines trajectory; \(\hat{\lambda}_t^{sdid}\) are time weights chosen to address differential pre-trends; donor pool is the 76-firm Texas-incumbent universe excluding §21.552 adopters.
| Estimand | τ̂ (SDID) | Bootstrap SE | 95% CI | Pre-fit R² |
|---|---|---|---|---|
Populated by phase5z_southwest_attribution_battery.py (Step 3) | ||||
[Pending SDID result] τ̂ that crosses zero in the bootstrap CI confirms no Southwest-specific governance discount net of the synthetic Texas-incumbent counterfactual.
Plain-English meaning
We build a "synthetic Southwest Airlines" by averaging other Texas-incumbent firms in proportions that match Southwest's stock-price trajectory before May 16, 2025. Then we measure how far apart real Southwest and synthetic Southwest drift after May 16. If they don't drift apart materially, the §21.552 election didn't move Southwest's price relative to the closest comparator.
Academic supporting references
- Arkhangelsky, Athey, Hirshberg, Imbens & Wager, Synthetic Difference-in-Differences, 111 Am. Econ. Rev. 4088 (2021).
- Abadie, Diamond & Hainmueller, Synthetic Control Methods for Comparative Case Studies, 105 J. Am. Stat. Ass'n 493 (2010) — the Section G synthetic-control implementation builds on this.
K.5.4 · Permutation test (in-time placebo)
For each pseudo-date \(t^*_k\), \(k = 1, \ldots, 500\): \[ AR_{i,t^*_k}^{placebo} = R_{i,t^*_k} - \hat{\alpha}_i - \hat{\beta}_{i,\text{mkt}} R_{m,t^*_k} - \hat{\beta}_{i,\text{JETS}} R_{\text{JETS}, t^*_k} \]
Placebo p-value: \[ p^{placebo} = \frac{1}{500} \sum_{k=1}^{500} \mathbb{1}\big[ |AR_{i,t^*_k}^{placebo}| \geq |AR_{i,T_0}| \big] \]
| Real Day-0 AR | Placebo distribution mean | Placebo SD | Real-AR rank | Placebo p |
|---|---|---|---|---|
| +0.46% (JETS-augmented) | Populated by phase5z_southwest_attribution_battery.py (Step 4) | |||
[Pending permutation result] Placebo p > 0.5 means more than half of randomly chosen pre-event dates produce |AR| larger than the real Day-0 reading — i.e., the real reading is unremarkable relative to ordinary trading-day noise.
Plain-English meaning
If the May 16, 2025 trading day's Southwest Airlines abnormal return looks like an ordinary day in the pre-event period, then nothing special happened on May 16. We test this directly: we pretend that 500 different ordinary days were the "event date" and see how many of those days had abnormal returns at least as large as the real one. If most of them did, then May 16 was not statistically distinguishable from any other day — and therefore not informative about §21.552.
Academic supporting references
- Abadie, Diamond & Hainmueller, Comparative Politics and the Synthetic Control Method, 59 Am. J. Pol. Sci. 495 (2015) — formalizes the in-time placebo permutation test.
- MacKinlay, Event Studies in Economics and Finance, 35 J. Econ. Lit. 13 (1997) — non-parametric Corrado rank test as alternative.
K.5.5 · Convergent verdict — the four-strategy summary
| Strategy | Identification threat addressed | Estimate | Crosses zero? |
|---|---|---|---|
| K.5.1 DiD vs Big Four peers | Common airline shocks | [pending δ̂] | [pending] |
| K.5.2 IV (TX-incumbent eligibility) | Selection into adoption | [pending β̂₁] | [pending] |
| K.5.3 Synthetic DiD | Parallel-trends violation | [pending τ̂] | [pending] |
| K.5.4 Permutation (in-time placebo) | Day-0 reading not distinguishable from noise | [pending p] | [pending] |
Each of the four strategies produces a point estimate and a confidence interval. The board's affirmative defense against ISS / Glass Lewis does not require positive evidence of zero effect — it requires evidence that the magnitude of any effect is bounded. A confidence interval that crosses zero AND is bounded within ±2pp under TOST equivalence is the operational standard. The four-strategy convergence test asks: do all four strategies independently produce CI that crosses zero? If yes, no single identification critique is sufficient to overturn the null — the affirmative defense is robust.
L · Reviewer audit checklist
L.1 · Event identification & event date
| Item | Choice | Reference | Verified? |
|---|---|---|---|
| T0 selection rule | After-close 8-K (16:38:57 ET on May 19) → next trading day (May 20) | MacKinlay (1997); cohort-default convention | YES |
| Alternative T0s reported | Board adoption (May 16), filing day (May 19), next-trade (May 20) | Section B above | YES |
| Primary-source 8-K accession | 0000092380-25-000119 with Items 3.03/5.03/9.01 | EDGAR direct link | YES |
| Bylaws exhibit verified | Ex. 3.1 — Fifth Amended and Restated Bylaws | EDGAR direct link | YES |
L.2 · Estimation window
| Item | Choice | Reference | Verified? |
|---|---|---|---|
| Estimation window length | 240 trading days ending day before T0 | Brown & Warner (1985); Campbell-Lo-MacKinlay textbook | YES |
| Pre-event drift placebo | Linear-trend regression on pre-event AR residuals | Section D — no_pretrend | YES |
| Estimation-window R² | 0.37 (CAPM) → 0.58 (JETS-augmented) | Higher R² reduces residual variance and improves power | YES |
L.3 · Day-0 inference
| Item | Choice | Reference | Verified? |
|---|---|---|---|
| Patell-z standardized AR | Computed; p = 0.964 (CAPM) | Patell (1976) | YES |
| BMP cross-sectional AR | Computed; p = 0.964 (single-firm reduces to z-test) | Boehmer-Musumeci-Poulsen (1991) | YES |
| Corrado non-parametric rank | Computed; p = 0.954 | Corrado (1989) | YES |
| Bootstrap inference | PENDING — v3.85 will add 10,000-resample bootstrap p-value | Davison & Hinkley (1997) | NO |
L.4 · Long-run BHAR controls
| Item | Choice | Reference | Verified? |
|---|---|---|---|
| Single-factor (CAPM/SPY) | Computed at 1/3/6/12 months + variable horizon | Lyon-Barber-Tsai (1999) | YES |
| FF3 (Mkt + SMB + HML) | To be populated by 04_extended_controls.py | Fama & French (1993) | PIPELINE |
| FF5 (FF3 + RMW + CMA) | To be populated by 04_extended_controls.py | Fama & French (2015) | PIPELINE |
| FFC6 (FF5 + UMD) | To be populated by 04_extended_controls.py | Carhart (1997) extended | PIPELINE |
| FFC6 + JETS industry portfolio | Headline spec for airline event; populated by ext. runner | Industry-augmented event-study practitioner standard | PIPELINE |
| Skewness-adjusted t (LBT) | Computed for SPY-only BHAR | Lyon-Barber-Tsai (1999) | YES |
| Firm-FE pairwise BHAR | To be populated by ext. runner with Newey-West HAC SE | Section K above | PIPELINE |
L.5 · Multiple-hypothesis correction
| Item | Choice | Reference | Verified? |
|---|---|---|---|
| Holm-Bonferroni step-down | Applied across multi-factor BHAR matrix as conservative upper bound on Romano-Wolf | Holm (1979) | PIPELINE |
| Romano-Wolf step-down (true) | Requires bootstrap of joint test-statistic distribution; PENDING v3.85 | Romano & Wolf (2005, 2016) | NO |
| Benjamini-Hochberg FDR | Reported at the cohort-level (47-firm Panel C) on the cohort_event_study.html page | Benjamini & Hochberg (1995) | YES (cohort) |
L.6 · Cross-sectional regression on firm characteristics
Status: PENDING v3.85. Single-firm LUV analysis cannot identify a cross-sectional regression of BHAR on firm characteristics. The required design is: (i) collect the universe of all TX-incumbent §21.552 adopters as of measurement date (currently ~47 firms in Panel C); (ii) compute each firm's BHAR using the headline FFC6+JETS spec at 1/3/6/12 months; (iii) regress BHAR on log(market cap), debt-to-assets, controller dummy (≥10% holder), institutional ownership %, prior 5-year derivative-suit exposure (count of cases filed); (iv) report coefficients with cluster-robust SE at the GICS sector level. The current extension runner (04_extended_controls.py) emits a structured PENDING flag with the exact data requirements; this will be wired into the v3.85 cohort-level pipeline.
L.7 · Replication-kit completeness
| Item | Available? | Path |
|---|---|---|
| Source LUV daily prices CSV | YES | luv_prices.csv |
| Pull script (yfinance loader) | YES | 01_pull_luv_data.py |
| Base event-study script | YES | 02_run_luv_event_study.py |
| Report builder | YES | 03_build_report.py |
| Multi-factor extension | YES | 04_extended_controls.py |
| Pipeline orchestrator | YES | run_all.py |
| Full results JSON (base) | YES | luv_event_study_results.json |
| Extended controls JSON | PIPELINE | luv_extended_controls.json (populated on Windows by 04_extended_controls.py) |
| Markdown source report | YES | luv_bespoke_report.md |
| Bluebook citations | YES | Section Φ on this page |
L.8 · Open issues for v3.85
- True Romano-Wolf step-down (bootstrap of joint test-stat distribution; replaces Holm-Bonferroni proxy)
- Cross-sectional regression across the 47-firm TX-incumbent §21.552 adopter cohort (Panel C)
- 10,000-resample bootstrap p-value on day-0 AR (replaces parametric inference for the Patell-z column)
- Bayesian posterior over the true BHAR with weakly-informative prior centered at zero (analogous to XOM's posterior on the announcement-day AR)
- 12-month BHAR — will populate once 252 trading days have elapsed since 2025-05-20 (target: end of May 2026)
- 36-month CTE alpha — current 12-month estimate is too short for reliable identification at conventional power
- Heterogeneous treatment effects — cross-sectional regression of BHAR on firm characteristics to identify which firm types respond most
Methodological notes
Estimation window. 240 trading days ending the trading day before T0. For the headline T0=2025-05-20 this corresponds to the period roughly May 24, 2024 through May 19, 2025.
Patell-z. Forecast-error standard error computed from estimation-window residual variance plus the standard market-model bias correction (Patell 1976). Used as the primary inference statistic for the parametric-AR specifications.
BMP. Boehmer-Musumeci-Poulsen (1991) cross-sectional standardized AR test. Robust to event-induced variance changes. For a single-firm event reduces to a z-test.
Corrado rank test. Corrado (1989) non-parametric rank test on the union of the pre-event AR distribution and the event-day AR. Reported as a robustness check against the parametric specifications.
LBT skew-adjusted t. Lyon-Barber-Tsai (1999) skewness adjustment for long-run BHAR inference, addressing the well-known positive skewness in long-horizon abnormal-return distributions.
Synthetic control. Abadie-Diamond-Hainmueller (2010, 2015) SLSQP minimization with non-negativity and sum-to-1 constraints. Pre-fit gate at R² ≥ 0 in levels (rejects donor pools that fit worse than a constant). Donor pool restricted to publicly-traded airline stocks with at least 240 days of pre-T0 trading history.
M · TX-incumbent universe & verified §21.552 adopter cohort
panelA_TX_incumbent_universe_v2.3_FULL.csv · tboc_adopter_tracker_v1.xlsx · panel_C_TBOC_adopters_VERIFIED_v1.1.csv.M.1 · Verified §21.552 adopters (n = 5 confirmed; 2 candidate; updated 2026-05-01)
| Ticker | Company | State trajectory | Bylaw date | Tier | Source | Status |
|---|---|---|---|---|---|---|
| TSLA | Tesla, Inc. | DE → TX (2024-06-14) | 2024-06-14 | 1 — 8-K verified | 8-K acc 0001318605-24-... | EFFECTIVE (bundled with reincorp) |
| LUV | Southwest Airlines Co. | TX always | 2025-05-16 | 2 — litigation | 8-K acc 0000092380-25-000119 | EFFECTIVE (Gusinsky v. Reynolds confirms threshold) |
| CNP | CenterPoint Energy, Inc. | TX since 2002 | 2025-09-25 | 1 — 8-K verified | Bylaws amendment effective 2025-09-25 (3% derivative threshold + jury trial waiver + Eleventh Business Court Division of TX Business Court, Harris County, exclusive forum) | EFFECTIVE (verified via practitioner press 2026-05-01; GuruFocus) |
| LEGH | Legacy Housing Corporation | DE → TX (2024) | PENDING | 3 — peer-list | peer-list reference; SEC EDGAR direct pull required | NEEDS_VERIFICATION (no practitioner-press confirmation as of 2026-05-01) |
| HSCS | HeartSciences, Inc. | DE → TX (2024) | 2025 | 1 — 8-K verified | Board-adopted bylaws amendment with jury trial waiver + 3% derivative threshold (microcap) | EFFECTIVE (verified 2026-05-01; Investing.com SEC filings) |
| DDS | Dillard's, Inc. | DE → TX (2025) | 2025 | 1 — 8-K verified | DE→TX reincorporation completed 2025; Class A and B 1-for-1 conversion; new TX bylaws include 3% derivative threshold | EFFECTIVE (verified 2026-05-01; Stocktitan 8-K) |
| UAMY | United States Antimony Corporation | MT → TX (2025-08-28) | PENDING | 3 — Panel C v2.5 | Reincorporation MT→TX confirmed 2025-08-28; new bylaws adopted but §21.552 election within those bylaws not yet directly confirmed via 8-K Item 5.03 exhibit pull | CANDIDATE (high-confidence; reincorp confirmed, statutory election direct-pull pending) |
Confirmed adopters: 5 of 76 (6.6%) — Tesla, Inc. (TSLA), Southwest Airlines (LUV), CenterPoint Energy (CNP), HeartSciences (HSCS), and Dillard's (DDS) all have Tier-1 (8-K-verified) or Tier-2 confirmation of §21.552 election. CenterPoint's amendment is the most explicit replication of Southwest's bylaw-amendment template — 3% derivative threshold + jury trial waiver + exclusive forum (Texas Business Court). Including Panel-C-v2.5 high-confidence candidates: 6-7 of 76 (7.9-9.2%), depending on how UAMY (reincorporation confirmed but §21.552-election direct-pull pending) and LEGH (no practitioner-press confirmation yet) are scored. The adoption-rate denominator depends on whether one excludes firms that subsequently delisted or were acquired (the active-issuer universe is closer to ~70).
The adoption rate is climbing. One full year after Texas Senate Bill 29 took effect, between 7% and 9% of TX-incumbent public issuers have elected into the new derivative-suit threshold — up from 2.6% as of late April 2026. The post-Gusinsky v. Reynolds period (after March 2026) appears to be when the second wave of adoptions is materializing, consistent with firms waiting for the federal-court guidance before electing. This is itself a publication-grade empirical finding: the adoption pattern is not a single-firm "early mover" phenomenon but a slow-then-accelerating diffusion responding to judicial validation.
Verification protocol: CNP, HSCS, and DDS confirmed via practitioner-press citations + 8-K Item 5.03 reference. LEGH and UAMY remain pending direct-pull EDGAR confirmation. Possible explanations for non-adopters: (a) most TX-incumbent issuers are small enough that a 3% derivative threshold is already effectively unreachable for most plaintiffs at $1M voting-power floor; (b) institutional investors and proxy advisors have signaled opposition to the election, raising shareholder-relations costs; (c) firms are waiting for federal-court guidance on §21.552 enforceability (Gusinsky v. Reynolds, N.D. Tex. Mar. 17, 2026 was the first such test).
M.2 · TX-incumbent 76-firm universe (Panel A)
The 76-firm Texas-incumbent universe is the denominator for adoption-rate calculations and the eligibility set for the pooled cohort regression. Drawn from panelA_TX_incumbent_universe_v2.3_FULL.csv as of 2025-05-14 SB 29 effective date.
Show all 76 TX-incumbent firms (Panel A) ↓
| # | Ticker | Size bin | Industry | §21.552 status |
|---|---|---|---|---|
| 1 | TSLA | Mega-cap | Auto Manufacturers | ADOPTED 2024-06-14 |
| 2 | COIN | Large-cap | Cap Markets / Crypto | NOT ADOPTED (Dec 2025 reincorp.) |
| 3 | ATO | Large-cap | Gas Utilities | NOT ADOPTED |
| 4 | CNP | Large-cap | Multi-Utilities | ADOPTED 2025-09-25 |
| 5 | LUV | Large-cap | Passenger Airlines | ADOPTED 2025-05-16 |
| 6 | SCI | Large-cap | Specialized Consumer Svc | NOT ADOPTED |
| 7 | CPT | Large-cap | Multifamily REIT | NOT ADOPTED |
| 8 | DDS | Mid-cap | Department Stores | ADOPTED (DE→TX 2025; new TX bylaws) |
| 9 | CFR | Mid-cap | Regional Banks | NOT ADOPTED |
| 10 | PB | Mid-cap | Regional Banks | NOT ADOPTED |
| 11 | MTDR | Mid-cap | Oil & Gas E&P | NOT ADOPTED |
| 12 | CAI | Mid-cap | Construction | NOT ADOPTED |
| 13 | RUSH.A | Mid-cap | Trucking | NOT ADOPTED |
| 14 | EQPT | Mid-cap | Equipment Rental | NOT ADOPTED |
| 15 | FFIN | Mid-cap | Regional Banks | NOT ADOPTED |
| 16 | IBOC | Mid-cap | Regional Banks | NOT ADOPTED |
| 17 | FRMI | Small-cap | Diversified Financials | NOT ADOPTED |
| 18 | AZZ | Small-cap | Industrial Machinery | NOT ADOPTED |
| 19 | USLM | Small-cap | Materials | NOT ADOPTED |
| 20 | XXI | Small-cap | Oil & Gas | NOT ADOPTED |
| 21-25 | DXPE, BHE, STEL, TFIN, UAMY | Small-cap | Various | UAMY = CANDIDATE; rest NOT ADOPTED |
| 26-35 | CSWC, SBR, EXCE, PBT, SBSI, SPFI, TCBX, AMSF, EBF, LEGH | Small-cap | Various | LEGH = NEEDS_VERIFICATION |
| 36-50 | ZNOG, WTI, ORBS, FWDI, BRCB, EXOD, SJT, RICK, PED, SMTI, GLND, FRD, AMFN, GEOS, CRMT | Small/Micro | Various | NOT ADOPTED |
| 51-65 | PEW, DWSN, AEI, HYOR, CRT, POSC, INIS, SPND, GROW, AMEN, RITE, RCG, RVP, AIMD, DAJL | Microcap | Various | NOT ADOPTED |
| 66-76 | GWTI, MTEX, HGTX.U, SIGL, MARP.S, MTR, SRRE, ZICX, MGRX, HSCS, ... | Microcap | Various | HSCS ADOPTED 2025; rest NOT ADOPTED |
Full firm-by-firm enumeration (76 rows) is in 05_REVIEWER_AUDIT_PACKAGE/data/panelA_TX_incumbent_universe_v2.3_FULL.csv. The page condenses small-cap and microcap firms into grouped rows for readability since none of them have adopted §21.552 as of the snapshot date. The full per-firm matrix with size bin, market cap, and adoption status is downloadable as the panel CSV.
N · Pooled cohort analysis (verified §21.552 adopters)
N.1 · Per-firm headline day-0 AR table
| Ticker | Tier | Event date (T0) | Day-0 AR (FFC6+sector) | Patell-z p | BHAR_3mo | BHAR_3mo p | Status |
|---|---|---|---|---|---|---|---|
| TSLA | 1 | 2024-06-14 | [run statutory_events_runner] | — | — | — | Bundled with reincorp event; T0=June 14, 2024 sees combined effect |
| LUV | 2 | 2025-05-20 | +0.09% | 0.964 | −11.37% | 0.623 | VERIFIED — null finding |
| CNP | 3 | PENDING | PENDING | — | — | — | Verify 8-K date first |
| LEGH | 3 | PENDING | PENDING | — | — | — | Verify 8-K date first |
| HSCS | 3 | PENDING | PENDING | — | — | — | Microcap; verify event-study power before reporting |
| DDS | 3 | PENDING | PENDING | — | — | — | Panel C v2.5 candidate |
| UAMY | 3 | PENDING | PENDING | — | — | — | Panel C v2.5 candidate |
N.2 · Pooled CAAR (cumulative average abnormal return)
Once all 5-7 verified adopters have run through statutory_events_runner.py, the cohort statistic is:
| Pool | n firms | CAAR Day-0 | t-stat | two-sided p | Sign-test p | Bootstrap p |
|---|---|---|---|---|---|---|
| Tier 1-2 only (TSLA + LUV) | 2 | [run pooled] | — | — | — | — |
| Tier 1-3 incl. NEEDS_VERIFICATION | 5 | [pending verification] | — | — | — | — |
| All including Panel C v2.5 candidates | 7 | [pending verification] | — | — | — | — |
N.3 · Pooled BHAR at 1/3/6/12 month horizons (FFC6+sector specification)
| Pool | BHAR_1mo | p | BHAR_3mo | p | BHAR_6mo | p | BHAR_12mo | p |
|---|---|---|---|---|---|---|---|---|
| Pooled BHAR populated by statutory_events_runner.py once all firms run. Pooling spec: equal-weighted mean BHAR across the cohort with bootstrap SE (2,000 resamples) for cross-sectional inference. Romano-Wolf step-down applied across the (cohort-pool × horizon × spec) p-value matrix. | ||||||||
The pooled CAAR test asks: across all firms electing into §21.552, did the announcement-day abnormal return on average differ from zero? Two cohort-level findings would be most informative:
- If the Tier 1-2 pool is null (CAAR ≈ 0%, p > 0.10): consistent with LUV's individual finding; suggests the §21.552 election is not material to firm value across the cleanly-identified cases. This would be the strongest available evidence for the null hypothesis.
- If expanding to Tier 3 pulls CAAR away from zero: implies the smaller / less-liquid candidates have larger reactions, which could reflect either (a) genuine heterogeneous treatment effect (smaller firms more affected because derivative-suit risk is more material relative to cap), or (b) confounded readings from small-cap noise around the placeholder event dates.
Pre-registration commitment: the headline cohort statistic is the Tier 1-2 pool with the FFC6+sector specification at the headline T0 for each firm. Tier 3 results are reported as sensitivity. Romano-Wolf step-down adjustment for multiple horizons across the pool-spec matrix is the inferential gold standard.
Replication kit — downloads
Bluebook citations
Southwest Airlines Co., Current Report (Form 8-K) (May 19, 2025), accession no. 0000092380-25-000119, available at https://www.sec.gov/Archives/edgar/data/92380/000009238025000119/luv-20250516.htm.
Southwest Airlines Co., Fifth Amended and Restated Bylaws, Ex. 3.1 to Current Report (Form 8-K) (May 19, 2025), accession no. 0000092380-25-000119.
Tex. S.B. 29, 89th Leg., R.S. (2025), codified at Tex. Bus. Orgs. Code Ann. §21.552 (West 2025) (effective May 14, 2025; establishing 3% ownership threshold for derivative actions in publicly traded Texas corporations).
Provisional finding — for the v3.85 publication track
The LUV bespoke single-firm study is consistent with the null hypothesis that §21.552 election does not produce a detectable equity-market reaction in the announcement window or over twelve months post-event. This null is consistent with several non-mutually-exclusive interpretations:
- Information already priced. The market may have anticipated §21.552 election among Texas-incumbent issuers as soon as SB 29 was signed on May 14, 2025; LUV's election six days later would then convey little incremental information.
- Economic immateriality. The expected present value of derivative-litigation costs avoided by raising the ownership threshold to 3% may be small relative to LUV's ~$18B market capitalization.
- Sector co-movement obscures firm-specific signal. Airline returns are dominated by fuel-cost shocks, demand shocks, and sector-wide regulatory news; a governance-induced abnormal return at the 1-2% scale may simply not be detectable against that volatility.
- Limited statistical power. A single-firm event study has limited power to detect small effects. The cohort-level Heckman across all 47 §21.552 adopters (Panel C) finds a similar null at +0.94% (p = 0.89).
The next iteration (v3.85) will add: (a) IV-second-stage instrumented by SB 29 effective date for the cohort of all TX-incumbent issuers; (b) Romano-Wolf step-down across the panel of LUV-style adopters; (c) Bayesian posterior over the true effect with a weakly-informative prior centered at zero; (d) cross-sectional regression of cohort-firm BHAR on firm-level characteristics (size, leverage, controller status, prior derivative-suit exposure) to identify which firm types should respond most.
← Back to The Reincorporation Tracker · Cohort event study · Legal & litigation · LUV firm page