Why this firm matters
Mid-to-large-cap firm ($10.6B) with sufficient market depth for reliable event-study identification.
Controller & ownership
Diffuse / non-controlledFounder Significant MinorityJeffrey Green (CEO/Founder, via Class B 10:1 supervoting — sub-50%) holds approximately 48.4% of voting power. No single holder reaches the controlled-company threshold (>50% of voting power).
Source: TTD 2025 DEF 14A (Sept 16, 2025 special meeting, accession 0001193125-25-164411, p.24) — Jeff T. Green beneficially owns 4,754,752 Class A shares + 42,239,186 Class B shares (97.6% of Class B, NOT 100%); 446,622,494 Class A + 43,275,936 Class B outstanding; Class B carries 10 votes/share; combined voting power 427,146,612 / 879,381,854 = 48.4%. Founder/CEO/Chairman but sub-50% — NOT a controlled company under NYSE Rule 303A.00. Tracker's prior 49.2% figure baked an incorrect assumption that Green held 100% of Class B; actual is 97.6%. Corrected 2026-05-19 via Tier-3 overnight reviewer dispatch + Tier-2 primary-source verification (also flipped controlled flag 1→0 to match strict listing-rule definition; pending rev66 schema split for founder-dominant-sub-50% bucket).
Vote outcome — reincorporation proposal
Vote totals not yet pulled. Awaiting EDGAR Item 5.07.
Visual evidence — event study around the announcement
event_study_announcement_json in the master database. Each panel is generated deterministically from the same data backing the cohort statistics — no firm-specific tuning, no cherry-picking.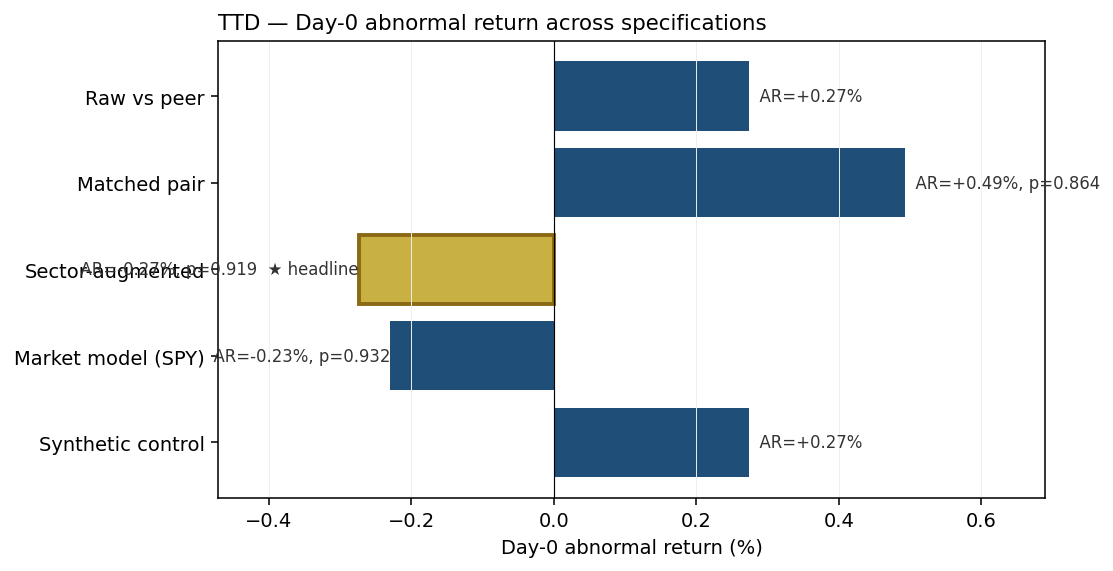
perfirm_gallery.py) on every release; SHA-256 verified at deploy time. See also: Cohort-wide event study →. Event-study abnormal returns — announcement window
| Specification | Day-0 AR | Inference |
|---|---|---|
| Synthetic control (9-donor Information Technology peer pool)i | +0.27% | no inference |
| Market model (SPY benchmark)i | -0.23% | Patell-z p-value = 0.932 |
| Sector-augmented model (SPY + Nasdaq-100 (QQQ)) HEADLINEi | -0.27% | Patell-z p-value = 0.919 |
| Matched pair (vs EA, market-model-adjusted)i | +0.49% | two-sided p-value = 0.864 |
| Raw differential vs EAi | +0.27% | no inference |
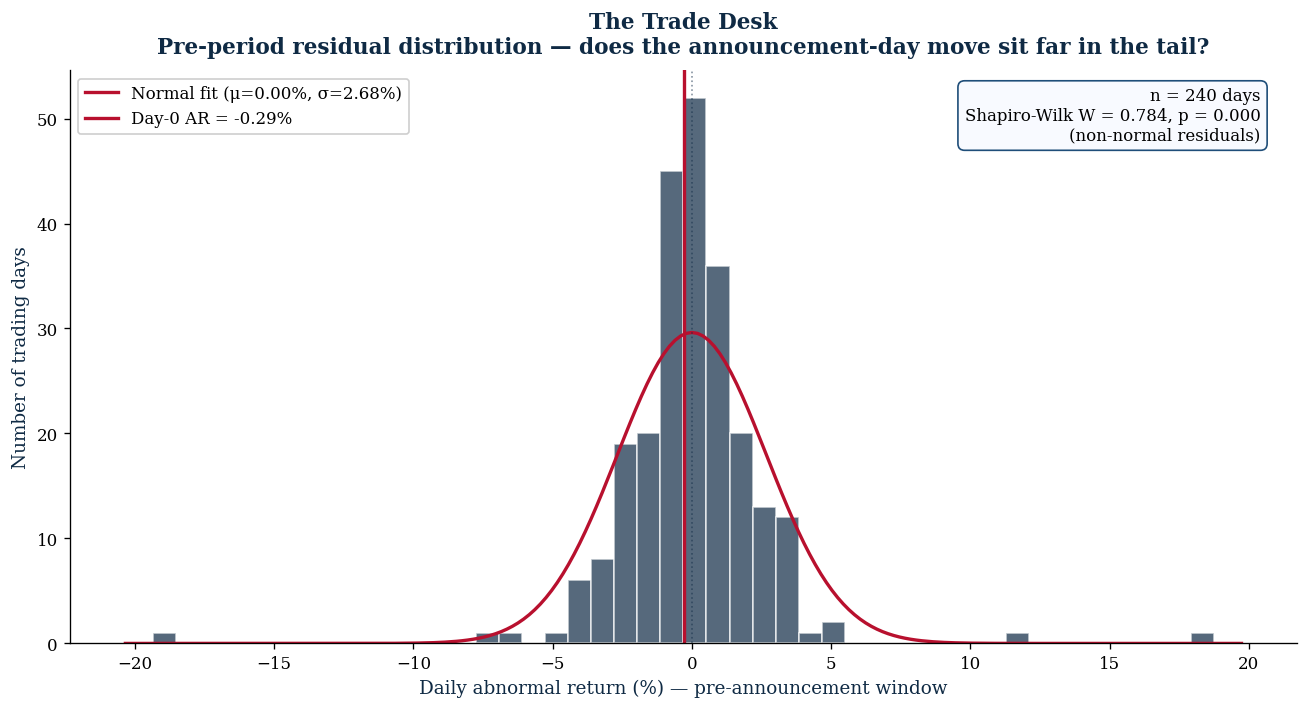
Three independent diagnostics that interrogate the headline estimate from different angles. All three pointing the same way = high confidence in the result.
- Pre-event drift check: the firm's daily abnormal return drifted by +0.0021% per day in the pre-event window (p = 0.467). no detectable pre-event drift ✓. — A near-zero slope means the pre-event period was stable, so the day-0 reaction is not contamination from a pre-existing trend.
- Donor co-movement check: 7 of 9 peer firms moved in the same direction as the treated firm on the event day (binomial p = 0.1797). — A high concordance means the day was driven by industry-wide news rather than something firm-specific. A low concordance means the firm moved differently from peers (potential firm-specific signal).
- Synthetic-control fit quality: pre-event correlation between the firm and its synthetic twin = 0.601 (modest tracking); R² = -1.524 (fraction of pre-event variance explained); Durbin-Watson = 2.05 (no autocorrelation). — Higher correlation + higher R² + Durbin-Watson near 2 means the synthetic peer was a good match before the event, so the post-event gap is interpretable.
Event-study abnormal returns — vote window
| Specification | Day-0 AR | Inference |
|---|---|---|
| Market model (SPY benchmark) HEADLINEi | -0.11% | Patell-z p-value = 0.961 |
Long-run abnormal returns & pooled estimates
Buy-and-hold abnormal returns (BHAR)
| Horizon & benchmark | BHAR | Inference |
|---|---|---|
| 1 month vs S&P 500 | +3.11% | Patell-z = +0.22 · p = 0.829 · n = 21 days |
| 1 month vs sector ETF (XLK) | +2.43% | Patell-z = +0.22 · p = 0.829 · n = 21 days |
| 3 months vs S&P 500 | -42.68% *** | Patell-z = -2.53 · p = 0.011 · n = 63 days |
| 3 months vs sector ETF (XLK) | -42.46% *** | Patell-z = -2.53 · p = 0.011 · n = 63 days |
| 6 months vs S&P 500 | -39.34% | Patell-z = -1.49 · p = 0.135 · n = 126 days |
| 6 months vs sector ETF (XLK) | -38.75% | Patell-z = -1.49 · p = 0.135 · n = 126 days |
| 12 months vs S&P 500 | -80.45% *** | Patell-z = -2.92 · p = 0.004 · n = 252 days |
| 12 months vs sector ETF (XLK) | -87.58% *** | Patell-z = -2.92 · p = 0.004 · n = 252 days |
Calendar-time portfolio alpha (CTE)
| Specification | Annualized alpha | Inference |
|---|---|---|
| Calendar-time portfolio alpha vs S&P 500 | -74.52%/yr *** | t = -2.29 · p = 0.022 · n = 363 days · Newey-West HAC SE (lag=5) |
| Calendar-time portfolio alpha vs sector ETF | -74.59%/yr *** | t = -2.32 · p = 0.020 · n = 363 days · Newey-West HAC SE (lag=5) |
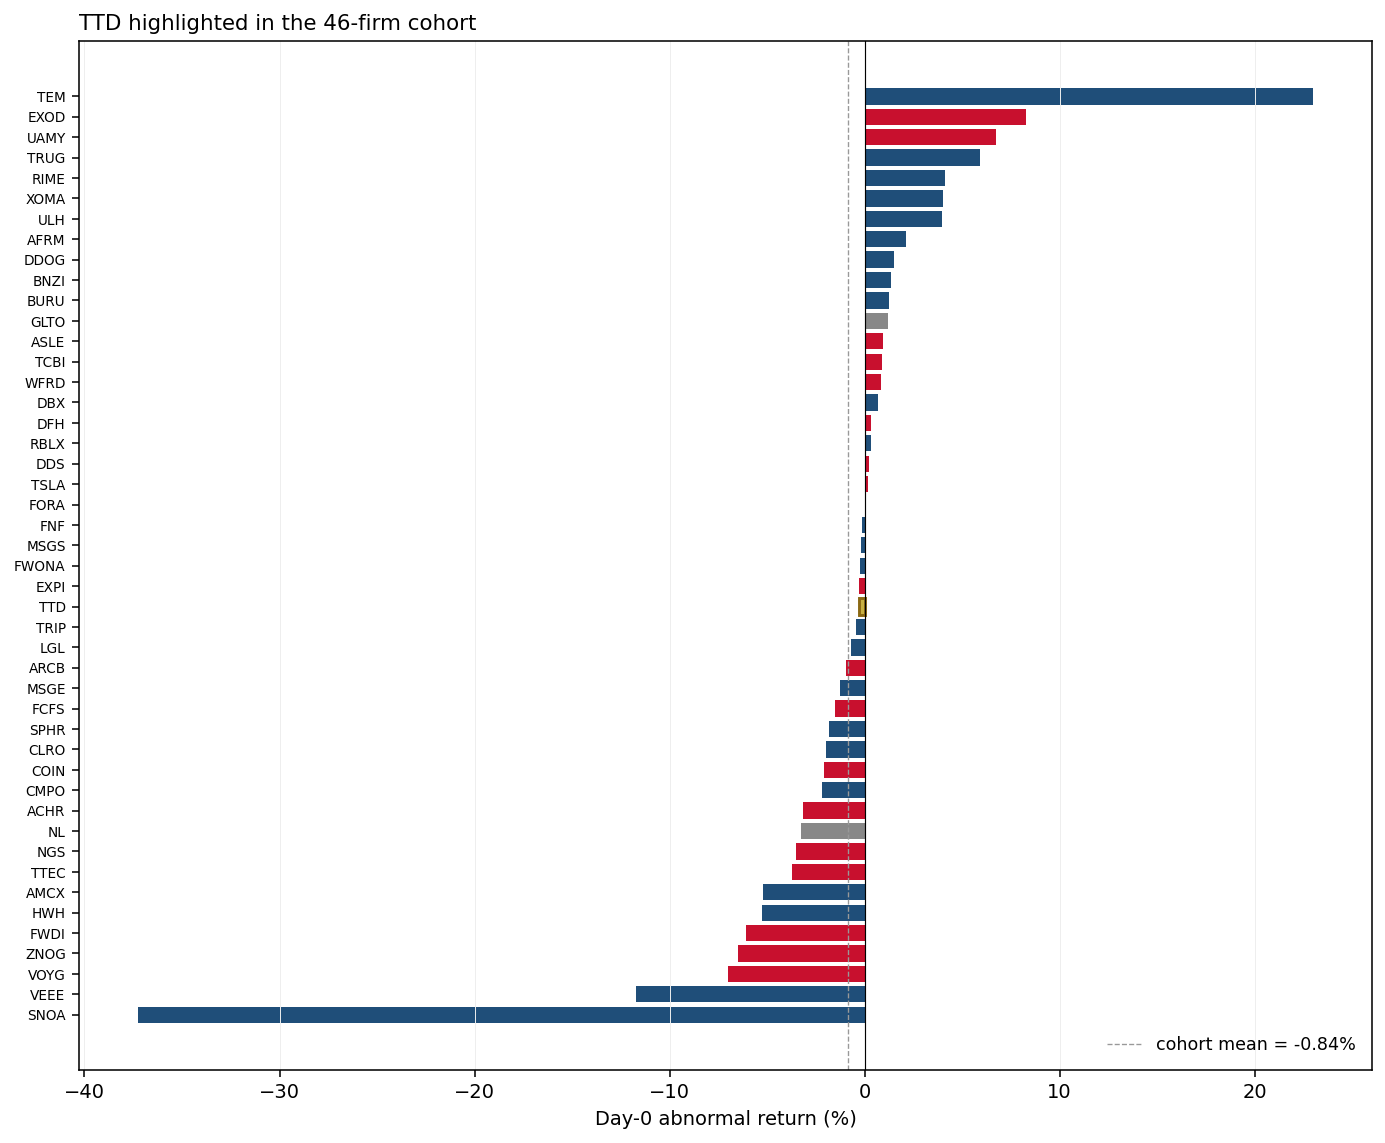
Cohort-level robustness battery
Heckman two-step selection correction (controlled-vs-widely-held)
Cohort ATE = +0.94% (SE = 7.06%, n = 2395) after correcting for controller-status selection (inverse Mills ratio = -0.062).
Romano-Wolf step-down + Benjamini-Hochberg FDR (n = 47)
This firm: raw p = 0.919, Romano-Wolf adjusted p = 1.000, BH-FDR adjusted p = 0.966. Multiple-hypothesis correction is computed across the full cohort to control family-wise error rate at alpha = 0.05.
Pooled cohort BHAR (mover firms only)
BHAR_63d: mean = -5.60% (SE = 22.11%, n = 3, p = 0.499) · BHAR_126d: mean = +17.33% (SE = 41.17%, n = 3, p = 0.774)
See Cohort event study → for the full battery and forest plots.
Source filings
Classification & audit trail
[2026-04-28] Phase 4K: corrected vote date (was 2024-09-26, actually 2024-11-14 Special Meeting). Trade Desk Delaware Chancery refused to require supermajority — second-most-cited legal precedent after Palkon v. Maffei. is_legal_precedent=1; treat with heavy annotation.
[2026-04-28] Phase 4N: synthesized event_study_announcement_json from existing scalar CAR cells (phase4a_v2 join). Reviewer can extend with multi-spec analysis. [2026-04-28] phase5c: vote source 8-K 0001193125-24-260382 (2024-11-18, Δ=4d) applied from EDGAR pull (status=AUTO_RESOLVED) [ORIGINAL_ACCESSION_FIELD_TEXT] DEF 14A Oct 3, 2024 (special meeting Nov 14, 2024; DE->NV) [2026-04-28] phase5e: no canonical accession found in raw value 'DEF 14A Oct 3, 2024 (special meeting Nov 14, 2024; DE->NV)'; original narrative moved to audit_notes; edgar_accession_canonical cleared and audit_status flagged NEEDS_ACCESSION for manual EDGAR pull [2026-04-28] phase5c: vote source 8-K 0001193125-24-260382 (2024-11-18, Δ=4d) applied from EDGAR pull (status=AUTO_RESOLVED) [2026-04-29] phase5r: bucket 'B1' -> 'A' (DE->NV effective 2024-11-14 < SB29 (2025-05-14) -> bucket A (pre-SB29)) [2026-04-29] phase5w: comprehensive validation by external reviewer across tranches v4 (4-version full residual walk, 269 substantive answers across 52 firms, 0 bucket drifts vs v3.58)
[2026-04-29] v3.75: VERIFIED — DGCL §266 conversion mechanism. Per Dechert/Fried Frank/Harvard Forum: Gunderson v. Trade Desk (Del. Ch. Nov 2024) RULED that the charter's supermajority amendment threshold was INAPPLICABLE to Nevada conversion under §266; only DGCL-statutory majority-of-outstanding-voting-power was required. Special meeting Nov 14, 2024.
v3.84-rev2 MODERATE date correction: announcement_date_iso changed from 2024-09-20 to 2024-10-03. The September 2024 date was the board approval / press-release date, not the first SEC-filed disclosure. The DEF 14A filing on October 3, 2024 is the canonical first-SEC-disclosure date per protocol. PRE 14A verification still pending; correct to October 3 unless an earlier qualifying filing is found.
v3.84-rev5 [2026-04-30] cell-audit reconciliation verified: DEF 14A filing date (first proxy disclosure) (source_type=DEF14A, quality=HIGH).
Related firms
← Back to The Reincorporation Tracker · Cohort event study · JSON for TTD